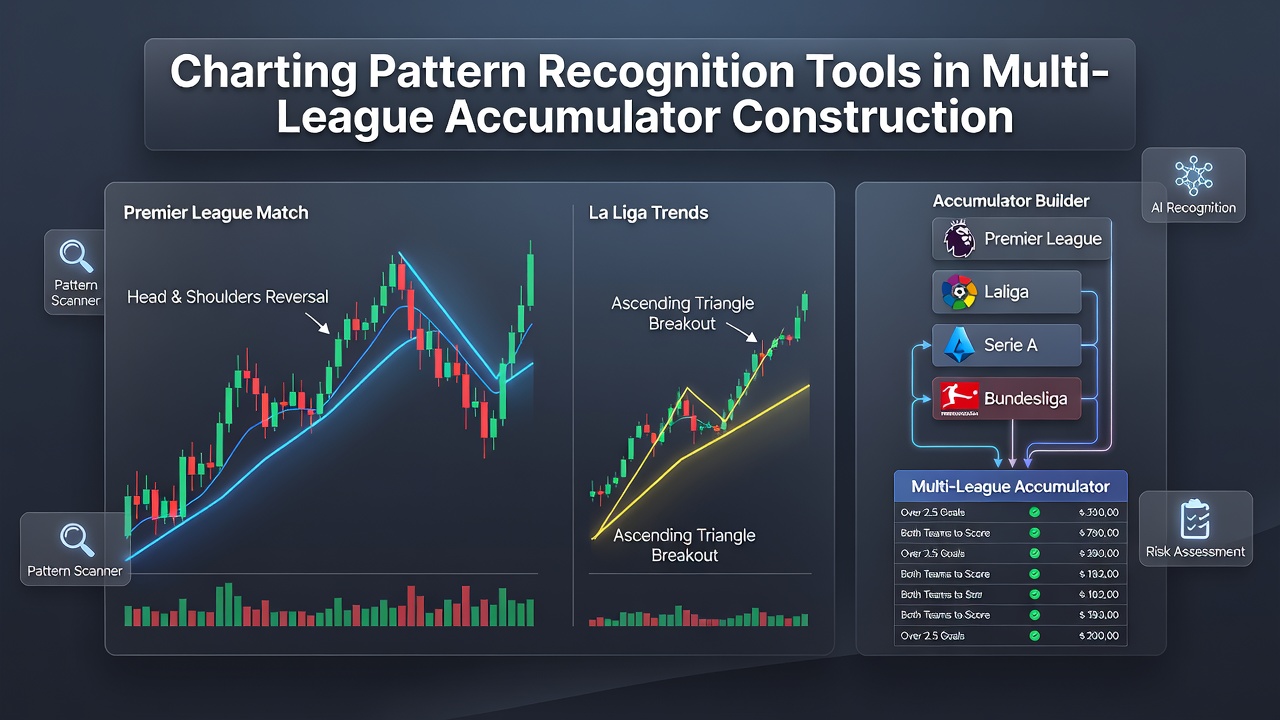
Pattern Recognition Charting for Multi-League Accumulator Construction
Pattern recognition charting tools help bettors identify recurring sequences across different sports leagues when building accumulators that combine selections from football, basketball, hockey and other competitions. These systems process historical performance data, head-to-head records and situational variables to flag potential correlations that span multiple markets simultaneously.
Core Components of Modern Charting Platforms
Most platforms combine time-series graphs with machine-learning overlays that highlight repeating formations such as home-team underperformance after midweek travel or elevated scoring rates following extended rest periods. Analysts load league-specific datasets into shared dashboards so patterns from one competition can be cross-referenced against another without manual re-entry of numbers.
Filters allow users to isolate variables like weather impacts on outdoor leagues or back-to-back scheduling effects in basketball, then project those filters onto football or baseball markets where similar fatigue markers appear. The software renders results as layered heat maps that update in real time as new fixtures are added to the accumulator matrix.
Data Integration Across Leagues
Effective multi-league construction requires simultaneous ingestion of schedules from major European football divisions, North American basketball conferences and international hockey circuits. Charting tools merge these feeds through common time stamps so a Thursday night NBA back-to-back can be plotted against a Friday evening football fixture involving comparable travel distances.
Research from the University of Nevada's sports analytics program shows that automated pattern matching reduces manual review time by approximately 40 percent when operators track eight or more selections across four different leagues. The same study noted improved detection of low-frequency correlations that human analysts routinely overlook during manual spreadsheet work.
Practical Application in Accumulator Building
Users begin by selecting a target payout range and number of legs, then apply pattern filters that scan for compatible risk profiles. A chart might reveal that certain mid-table football sides exhibit elevated draw tendencies when playing away teams on short rest, while concurrent NBA unders appear more frequently after high-scoring road wins. The platform places these observations on a single timeline so the accumulator can incorporate both legs without introducing contradictory variance.
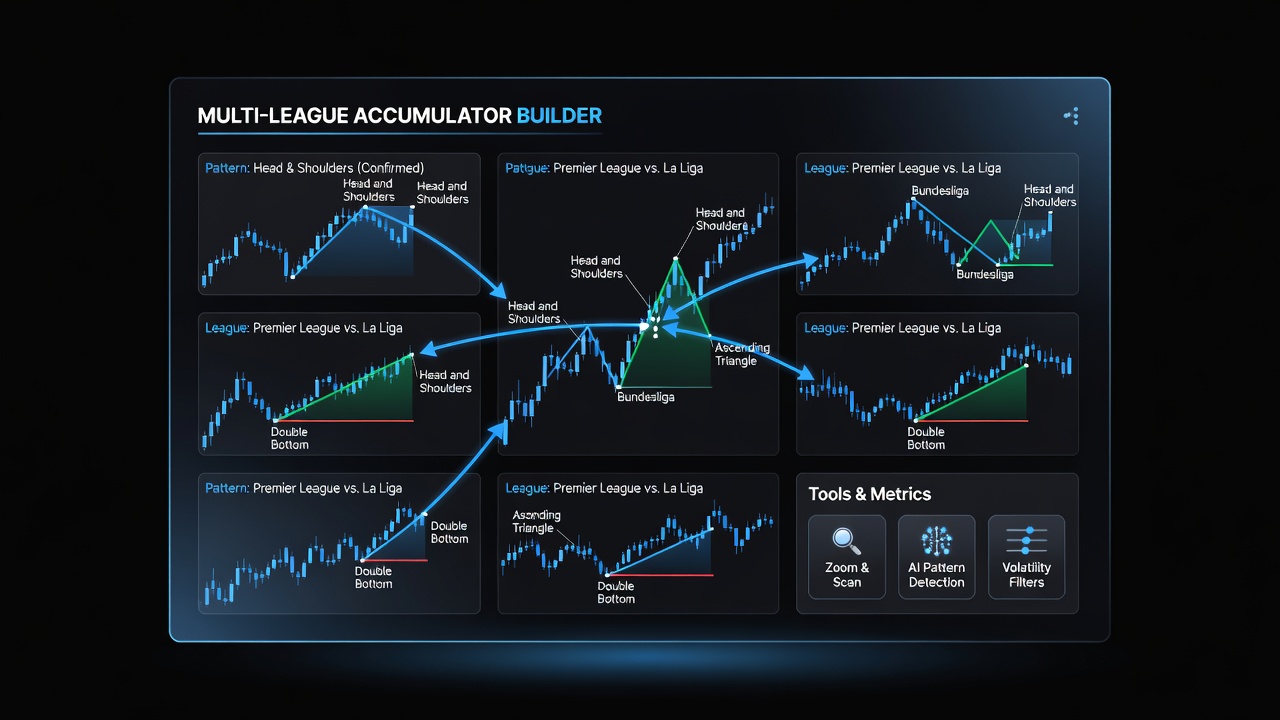
Operators in July 2026 have begun incorporating real-time schedule adjustments released by league offices during the summer transfer windows and off-season roster changes. These updates feed directly into the charting engines, allowing accumulators to reflect newly available rest-day data before markets fully adjust.
Limitations and Verification Steps
Pattern recognition remains dependent on data completeness; gaps in minor-league reporting or cancelled fixtures can produce false signals that require manual confirmation. Many platforms now include audit trails that tag each suggested correlation with source league and sample size so users can judge statistical reliability before locking selections.
Industry groups such as the European Gaming and Betting Association have published guidelines recommending minimum observation thresholds before patterns are used in live accumulator construction. These thresholds help ensure that tools flag genuine repeating structures rather than random clusters.
Conclusion
Charting pattern recognition tools continue to expand the scope of multi-league accumulator construction by automating cross-referencing tasks that once required extensive manual effort. As more leagues release granular scheduling data in 2026, these platforms gain additional inputs that refine correlation detection while maintaining the need for human oversight of edge cases and incomplete records.