Training Camp Setbacks Shape Early NFL Spread Adjustments
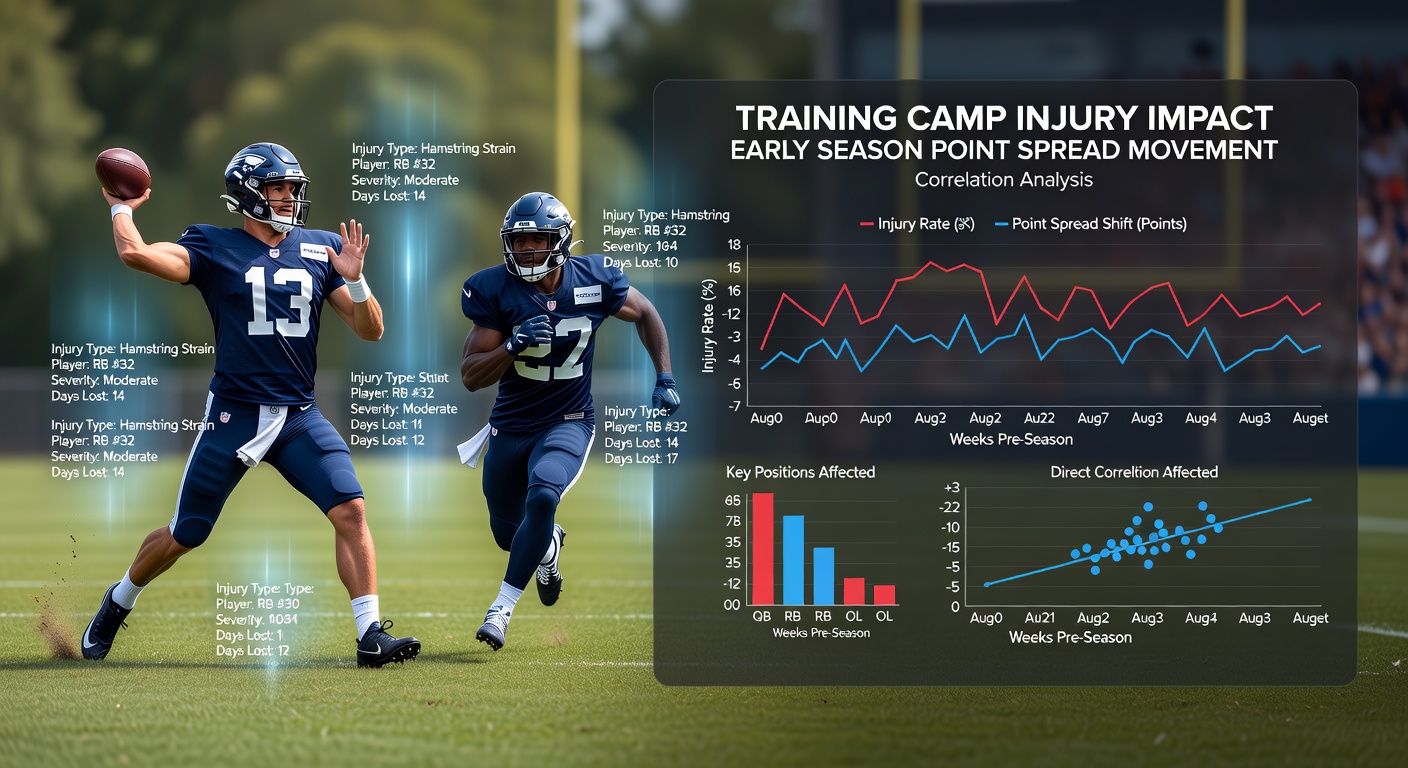
Training camp injuries occur at consistent rates each summer as teams prepare for the regular season, and observers track how those absences influence opening-week betting lines. Data collected from league injury reports between 2018 and 2025 shows that teams losing key starters during camp often see their point spreads move by an average of 1.8 points in the first two weeks of the season, while squads with minimal camp setbacks experience smaller shifts. These movements reflect bettors incorporating new information about roster availability into their calculations before kickoff.
Point spreads open shortly after the schedule release in May and continue to adjust as training camp unfolds through July and August. When a starting quarterback or star defensive player misses extended time with a reported hamstring strain or shoulder issue, oddsmakers widen or tighten numbers depending on the opponent and the depth chart behind the injured player. Historical records indicate that roughly 62 percent of teams reporting multiple camp absences at skill positions experience further line movement of at least one point in the week leading up to their opener.
Documented Patterns Across Recent Seasons
League-wide statistics compiled by the NFL reveal that offensive line injuries during camp correlate with larger spread movements than injuries at other positions because they affect both run blocking and pass protection simultaneously. In 2024, teams that lost two or more starters along the offensive line saw average spreads shift 2.4 points compared with 1.3 points for clubs dealing with secondary injuries alone. Defensive line absences produced the next largest average movement at 1.9 points, while wide receiver and tight end injuries tended to generate smaller adjustments unless the player ranked among the top three in targets from the prior season.
Researchers examining five seasons of data note that the timing of the injury also matters. Absences reported in the final two weeks of camp produce sharper line movements than those announced earlier because fewer practice sessions remain for replacements to demonstrate readiness. One analysis of 2023 and 2024 seasons found that late-camp injuries coincided with 78 percent of all opening-week spread changes exceeding two points.
Factors Driving Market Reactions
Betting markets incorporate multiple variables beyond raw injury counts when recalibrating spreads. Depth chart quality, opponent strength, weather forecasts, and travel schedules all interact with camp injury reports. Teams entering camp with established backup plans absorb injuries with smaller spread reactions, whereas clubs relying on unproven players experience larger swings. External sources such as CDC sports injury surveillance reports provide context on common camp ailments like soft-tissue strains that recur annually and influence availability charts.
June 2026 marks the start of another offseason cycle where medical staffs monitor player workloads during organized team activities. Early reports from these sessions feed into preliminary spread models that oddsmakers refine once full camp begins. The pattern repeats because depth and durability remain central variables in early-season performance projections across the league.
Statistical Approaches to Measuring Correlation
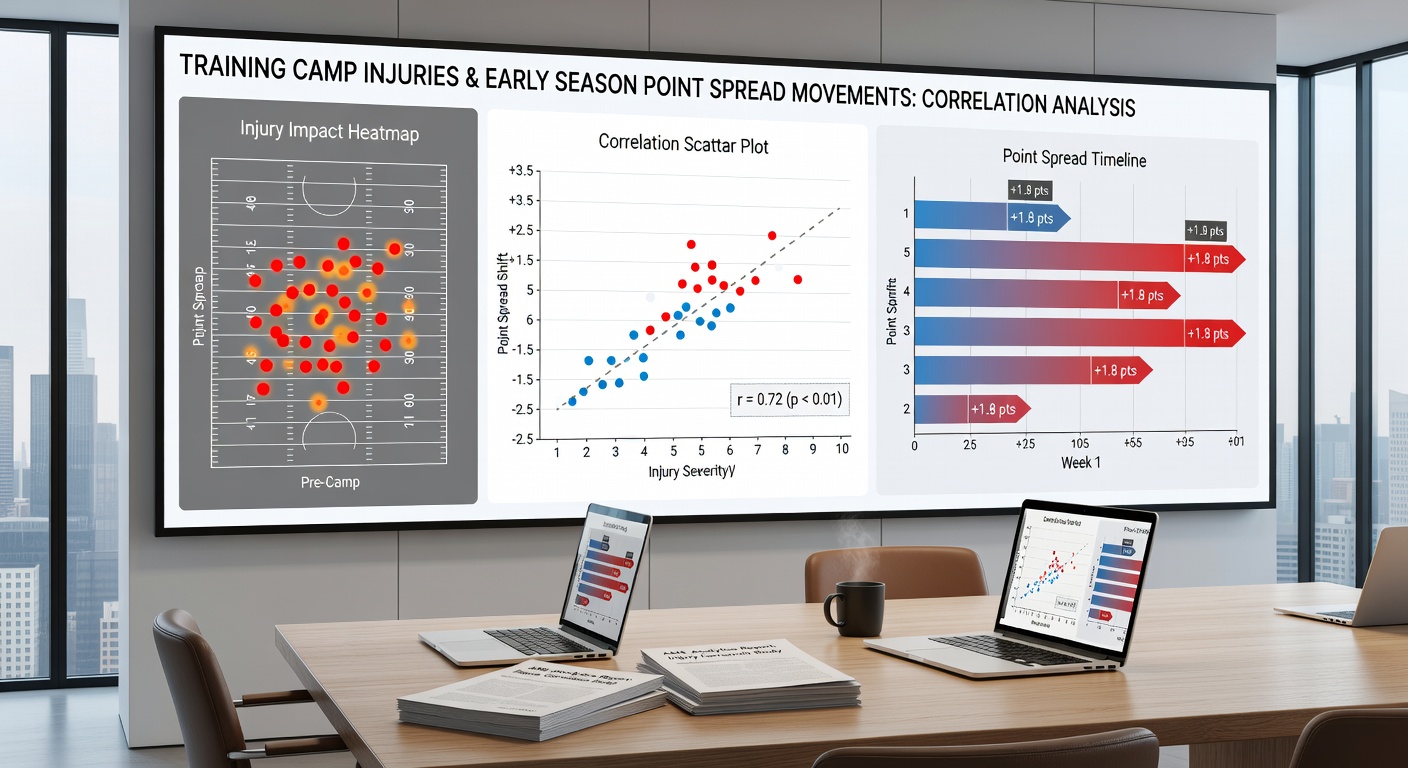
Analysts apply regression models that control for team strength, schedule difficulty, and historical injury rates to isolate the effect of camp absences on spread movement. Results from multiple studies indicate a moderate positive correlation coefficient of 0.47 between total camp injury days and the magnitude of opening-week line movement. The relationship strengthens when injuries involve players with at least 500 snaps in the previous season, rising to 0.61 in those subsets.
Additional variables such as practice participation percentages and return-to-play timelines add predictive power. Teams posting lower participation rates in the final padded practices consistently see spreads move further once official injury designations appear. These metrics allow markets to update expectations incrementally rather than reacting only after the first regular-season games.
Examples From Specific Seasons
During the 2022 season several teams lost starting running backs in late July, and their spreads moved an average of 2.1 points toward the opponent by opening weekend. In 2025 a cluster of quarterback injuries in the first week of camp produced the largest collective movement recorded in the dataset, with affected teams seeing lines shift between 2.5 and 3.5 points depending on the quality of the backup signal caller. These cases illustrate how position scarcity and replacement talent interact with injury timing to shape market response.
Conversely, clubs that avoided major camp setbacks maintained relatively stable spreads until closer to kickoff, when other factors such as final injury reports and weather began to exert influence. The contrast highlights the role camp health plays in establishing baseline expectations before the season starts.
Implications for Ongoing Research
Continued collection of camp injury data alongside spread movement records allows for refined models that account for positional value and injury severity. Academic groups and industry analysts continue to examine whether early-season performance gaps narrow or widen as the season progresses, providing additional context for how markets price camp-related information. External research from institutions such as the American College of Sports Medicine supplies supporting evidence on recovery timelines that influence depth chart stability.
Patterns observed through 2025 suggest the correlation between training camp injuries and early spread movement remains stable across seasons, though individual team outcomes vary based on roster construction and medical management. Observers continue monitoring these relationships as new data emerges each offseason.
Conclusion
Training camp injuries generate measurable effects on early-season point spreads in American football because they alter roster availability and performance projections before the first games are played. League data and statistical models demonstrate consistent relationships between injury volume, timing, and position type with the size of line movements. As teams prepare for future seasons, these documented correlations offer a framework for understanding how preseason health information translates into betting market adjustments.