Venue Characteristics and Their Influence on Point Spread Precision in College Athletics
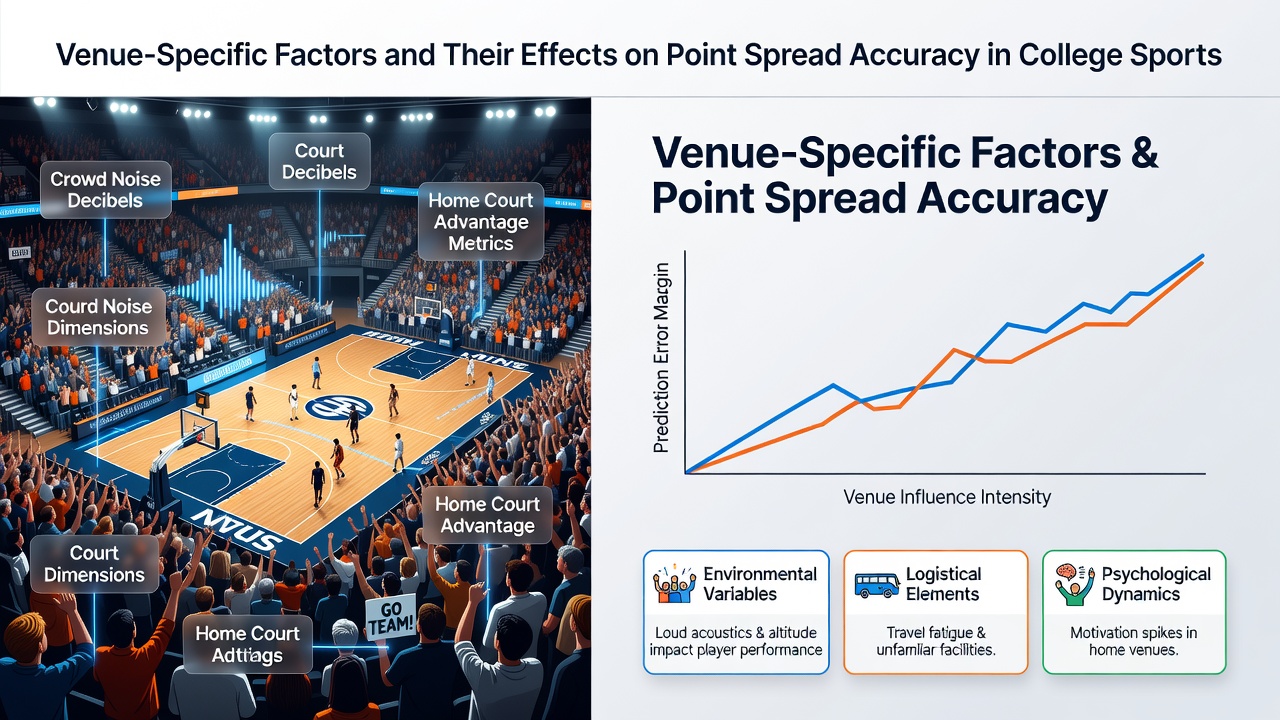
College sports venues introduce distinct variables that shape how point spreads perform across football, basketball, and other team competitions, and analysts track these elements through statistical models that compare expected margins against actual results. Data from multiple seasons shows that factors such as elevation, surface type, and spectator capacity create measurable deviations between projected spreads and final scores, which prompts oddsmakers to adjust lines accordingly. Researchers at institutions like the University of Michigan have documented how these venue traits affect both home and visiting teams in ways that standard travel or rest metrics do not fully capture.
Altitude and Climate Effects on Performance Metrics
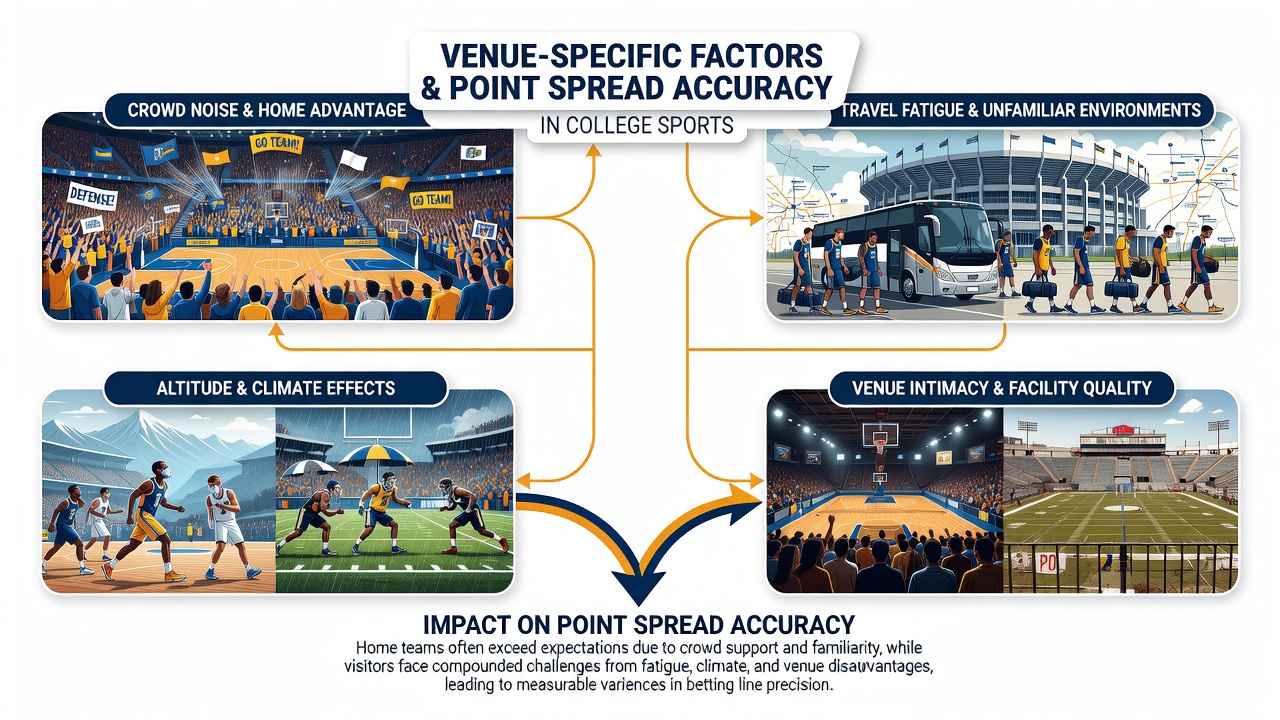
High-altitude locations such as those in the Mountain West Conference produce lower oxygen levels that reduce endurance for unacclimated squads, and studies indicate visiting teams cover spreads at lower rates when arriving from sea-level campuses. Temperature swings and humidity levels further alter ball handling and player fatigue, which leads to tighter scoring margins than models based solely on offensive and defensive rankings predict. Observers note that indoor venues eliminate many weather variables yet introduce lighting and air circulation differences that still shift free-throw percentages and three-point accuracy in basketball games.
Home Crowd Size and Noise Dynamics
Large stadiums with capacities exceeding 80,000 spectators generate sustained noise that disrupts communication between quarterbacks and offensive linemen, and historical data reveals these environments correlate with higher rates of false-start penalties and incomplete passes. Smaller arenas in mid-major conferences produce different pressure patterns, often allowing visiting teams to maintain rhythm because the auditory interference remains lower throughout the contest. Those who analyze play-by-play logs find that crowd density influences timeout usage and substitution patterns, which in turn modifies the pace that spread calculations assume will hold steady.
Travel Distance and Recovery Patterns
Cross-country flights create time-zone shifts that affect sleep cycles and reaction times, and records from the 2025-26 academic year show visiting teams from eastern conferences posting lower cover rates when playing at western venues with less than 48 hours between games. Shorter regional trips still introduce variables such as bus fatigue and unfamiliar hotel conditions, while back-to-back road games compound these effects in conference play. Analysts cross-reference flight manifests with performance statistics to quantify how recovery windows influence second-half scoring differentials that point spreads attempt to forecast.
Surface Type and Facility Layout Influences
Artificial turf versus natural grass changes traction and injury risk profiles, and data compiled through July 2026 indicates that teams accustomed to one surface encounter higher fumble and slip rates when competing on the other. Court dimensions and basket heights remain standardized in basketball, yet lighting angles, seating proximity, and baseline padding vary enough to affect defensive positioning and rebounding percentages. Facility age also plays a role because older venues often feature tighter concourses that limit warm-up space, which alters pre-game preparation routines that oddsmakers incorporate into spread construction.
Statistical Modeling and Accuracy Trends
Regression analyses that incorporate venue-specific coefficients demonstrate improved predictive power compared with models relying only on team efficiency ratings, and industry reports from organizations such as the National Collegiate Athletic Association highlight how these adjustments reduce mean absolute error in margin predictions. Longitudinal studies tracking spread accuracy across decades reveal that certain stadiums consistently produce outcomes that deviate from national averages, prompting line setters to apply persistent venue adjustments. International comparisons appear in research from bodies like the Australian Institute of Criminology sports integrity unit, where parallel venue factors in other leagues provide additional context for North American patterns.
Conclusion
Venue-specific elements continue to refine the calibration of point spreads as data collection grows more granular, and ongoing monitoring through the 2026 season allows modelers to isolate the contribution of each factor. Continued integration of real-time environmental sensors and player-tracking technology supplies fresh inputs that further tighten the relationship between projected and realized margins across college competitions.